Transforming Static Data into Living Wisdom: How Corporations Can Learn from our Earliest Scientists
By Elizabeth VanStee, Communication Designer, Gongos, Inc.
It’s no surprise that we’re living in the golden age of data. As a human race, we are more data hungry and data literate than ever before. And, nearly every sector across public interest and private business is experiencing a pronounced shift in the way we consume information and data.
In the public arena, we currently find ourselves in a presidential election cycle, where ongoing streams of data are collected, synthesized and served up to the masses on an hourly basis around-the-clock. Turn on CNN or log on to the New York Times and you’re bound to see data visualized in all shapes and dimensions, depicting the latest numbers and projections in shades of red and blue.
In the private sector, organizations have become more and more aware of the power held inside the data they have at their grasp, and are employing analysts and statisticians to mine the value within. Unfortunately, however, these precious gems often end their journey here like yesterday’s news. After being processed into skillfully arranged reports or templated infographics, they are often left to sit idle on shared drives.
Yet, just as an expert jeweler can spot a raw diamond and see its potential as a beautifully adorned piece of jewelry, organizational data too requires another process to make it not only aesthetically appealing, but functional and enduring.
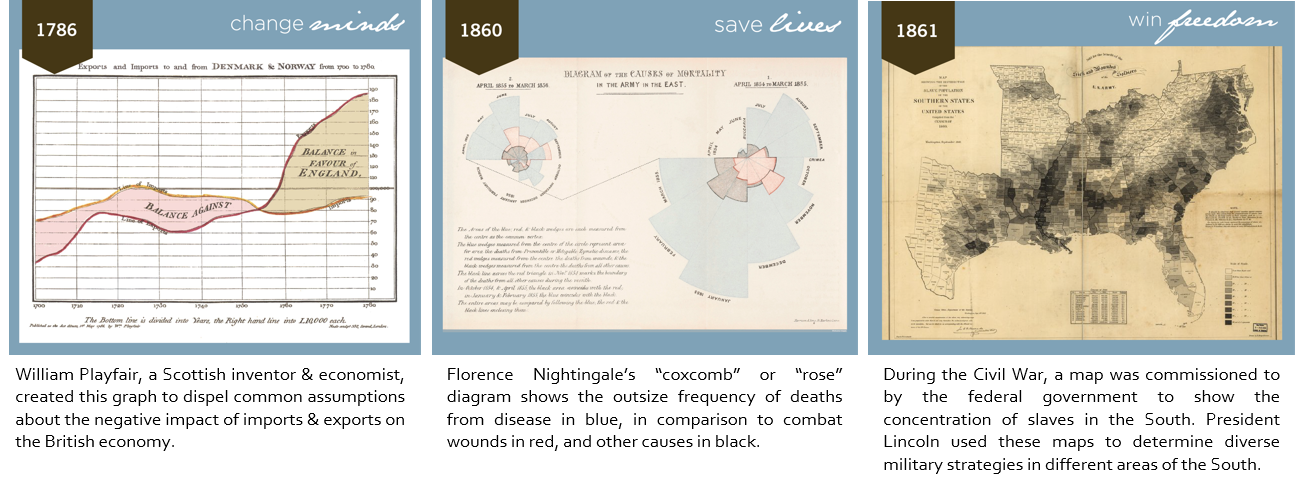
The field of information design was born of this very need to transform knowledge well beyond insight, and create a vehicle to spur critical action. Early data visualizers used the information they uncovered in bold new ways to actually change minds, save lives and set people free.
Let’s take a look at the trajectory of information design and then find our way back to:
- Why design matters in the consumption of information and data
- What corporations can learn from the earliest data visualizers of our time
The Era before the Era
While information design is now packaged as a near commodity, it began out of pure necessity. Scientists and early statisticians created the field as a way to be better understood. While there were many efforts to use data visualization to explain important concepts dating back to the 18th century, Florence Nightingale is often cited as the “mother of the modern infographic”. In addition to founding the modern practice of nursing, Nightingale was also an acclaimed statistician and social reformer. Using data collected over two years during the Crimean War, she crafted what is now referred to as her “coxcomb” graph which demonstrated that the primary cause of death was not combat-related, rather from “preventable disease” brought about by the terrible hygienic conditions. Nightingale presented this information to Queen Victoria, prompting her to create a sanitation commission whose efforts resulted in a sharp fall in death rates.
Information Design’s Impact on Journalism
The rise of data journalism in recent years further shows the impact that data can have on the way we think. The role of the journalist is playing a large part in democratizing data and in leveraging it to help shape public perception. No longer are they simply a reporter of facts and observations, but of raw data depiction—so much so, that journalism now encompasses the disciplines of statistics, computer science, and design. Amanda Cox, graphics editor at the New York Times, is a statistician by trade. She leads a department comprised of designers, statisticians and traditional journalists who leverage data to reveal patterns and provide context to global stories. Likewise, Nate Silver’s popular FiveThirtyEight blog has become the go-to source for up-to-the-minute election data and predictions.
The Inevitable Move to the Private Sector
The data revolution is happening in the private sector as well, but organizations often agonize about how to communicate this information in a compelling way, both in and outside their company walls. Consumer data offers a wealth of insights into behaviors and trends, yet there can be a communication breakdown when trying to connect insights with emotion, which can lead to inaction and stagnation. Why is this? Because human-created data is fundamentally different than data generated by machines. It is sometimes self-reported, sometimes rational, sometimes behavioral and frequently emotional. It has a distinctly human face and is often difficult to neatly quantify. Transforming these raw numbers into easy to use, functional and beautiful messages takes a truly special set of skills—and it is critical that organizations get this right.
Transforming Insights Organizations: Cultivating a left brain-right brain competency
Those in positions of influence in the B-to-C space are faced with the challenge of communicating consumer-based information upward and outward to fuel crucial decision making. But they often lack the right skillsets at their disposal to achieve this. Organizations simply haven’t been set up to incorporate the skillsets of insight curators, storytellers and communication designers within the methodological-and-business-strong insights function.
For decades, they have relied on creative and/or advertising agencies to cleverly craft the external representation of their brand, and this relationship is highly effective when the audience is the consumer. But what about when the topic is the consumer?
 The internalization of this kind of information, often laden with complex primary and behavioral data, requires a fundamentally different way of thinking, and executing. The end goal is markedly different: instead of trying to inspire mass consumers to buy a product, the task is convincing a handful of executives to make multimillion dollar decisions based on commissioned research and elaborate data. And beyond this, it is their duty to create empathy among decision makers of all levels to empower true depth of understanding not only of the data, but through fluencies across languages of learning, appropriate delivery modes and functional design.
These strategists, integration specialists, designers and editors focus on marrying left-brain observations with right-brain intuition to create deliverables that fully immerse stakeholders. Not only do they have the benefit of a thorough understanding of how to work with data; they have an inherent drive to create faithful, comprehensive portraits of consumers. And they believe that only by combining the rigor of research with the creativity and foresight of design can true, lasting change occur.
Our earliest data visualizers too craved ideal ways to be understood and move audiences as they discovered the power of the information at their disposal. Out of necessity, they pioneered uncharted ways of converting this knowledge for both consumption and action. When the insights, curation and design functions are truly working in concert, knowledge is transformed from static data into living wisdom. This alliance results in engaged and invested stakeholders motivated to turn insights into action, and confident in their abilities to do so.
Like those who went before us, organizations are now realizing the imperative of continuing to push forward and invent better ways to transform data into tremendous, lasting value. Only now, instead of surveying and amassing land, they are making multimillion dollar decisions based on the ever-growing nature of consumer wisdom and data.